A research proposal is an essential document that outlines the objectives, methodology, and timeline for a research project. It serves as a blueprint for the entire research process, guiding researchers in their work. One crucial aspect of a research proposal is the timeline, which helps researchers plan and manage their project effectively. To plan the timeline effectively, creating a Gantt chart is deemed important. Fortunately, there are many free Gantt chart maker tools available that make this process simple and accessible for students at any level.
In this comprehensive tutorial, we will explore the importance of using a Gantt chart for your research proposal. We will discuss the components of this chart, how to create one for your research proposal, best practices for designing a Gantt chart, and common pitfalls to avoid. By the end of this tutorial, you will have a solid understanding of how to effectively utilize a Gantt chart to enhance the planning and execution of your research proposal.
A Gantt chart is a visual project management tool that helps in planning, scheduling, and tracking the progress of specific tasks within a project. It was first introduced by Henry L. Gantt in the 1910s. It provides a visual representation of the timeline and tasks involved in your project, allowing you to effectively organize and track your progress.
A Gantt chart is a visual project management tool that helps in planning, scheduling, and tracking the progress of specific tasks within a project. It was first introduced by Henry L. Gantt in the 1910s. It provides a visual representation of the timeline and tasks involved in your project, allowing you to effectively organize and track your progress.
One of the main reasons why you need a Gantt chart for your research proposal is that it helps you to clearly define and communicate your project timeline. By breaking down your research into specific tasks and assigning them to specific time periods, you can ensure that you have a realistic plan in place. Additionally, this chart allows you to identify any dependencies between tasks. This means that you can determine which tasks need to be completed before others can begin, ensuring that your project progresses smoothly and efficiently. In terms of time management, the Gantt chart is an invaluable tool as it allows you to allocate time effectively, track progress, and stay on schedule, helping you meet deadlines and optimize your productivity throughout the research process.
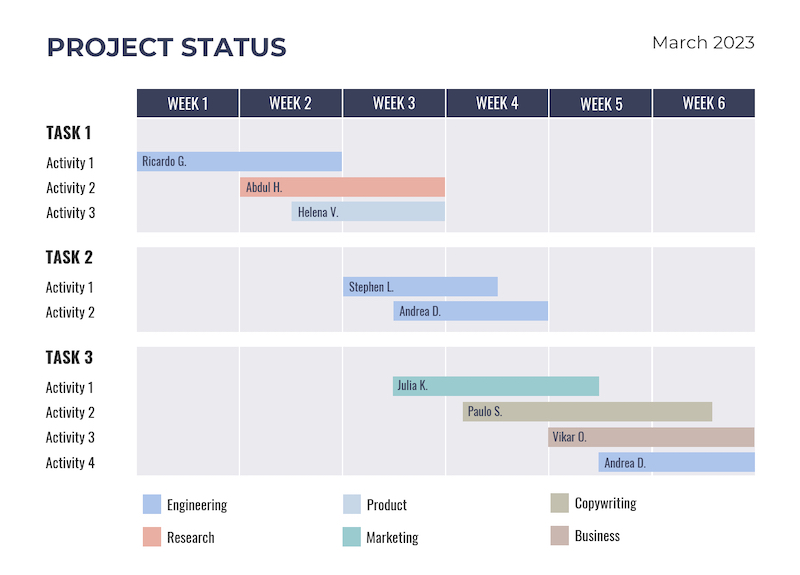
A Gantt chart consists of several key components that help in visualizing and managing the timeline of a research proposal.
The left side of the chart lists the project activities or tasks that need to be completed. These activities are usually represented as a series of horizontal bars.
The top of the chart shows the time frame for the research proposal. It can be divided into days, weeks, months, or any other relevant time units depending on the duration of the project.
A Gantt chart shows the dependencies between different activities. Dependencies indicate the order in which tasks need to be completed. For example, if Task B depends on Task A, Task B cannot start until Task A is completed.
This chart also includes information about the resources required for each activity. This can include personnel, equipment, or any other necessary resources.
Milestones are significant events or achievements in the research proposal. They are represented as vertical lines on the chart and help in tracking progress and evaluating the overall timeline of the project.
By including these components in a Gantt chart, researchers can effectively plan and manage their research proposal, ensuring that tasks are completed in the right order and within the specified time frame.
The first step in creating a Gantt chart is to make a project table. List all the activities that you plan to do in your research project. This can include tasks such as literature review, data collection, data analysis, and writing the final report. Make sure to include the start and end dates for each activity.
Once you have your project table, you can create a bar chart. This chart will represent the timeline of your project. The horizontal axis of the chart represents the time period, while the vertical axis represents the activities.
Next, you need to add data to your bar chart. For each activity, determine the duration and dependencies. The duration is the amount of time it will take to complete the activity, while the dependencies are the activities that need to be completed before the current activity can start.
To make your chart more informative, add task descriptions to each activity. This will help you and others understand what needs to be done for each task.
Finally, transform your bar chart into a Gantt chart by adding the start and end dates for each activity. This will give you a visual representation of the project timeline and help you track the progress of your research proposal.
When designing this chart for your research proposal, it is important to follow some best practices to ensure its effectiveness and accuracy. Here are some key tips to consider:
Before creating your Gantt chart, make sure you have a clear understanding of the scope of your research proposal. This includes identifying the objectives, deliverables, and timeline of your project. Having a clear project scope will help you accurately plan and schedule your tasks.
To create a detailed and comprehensive Gantt chart, it is essential to break down your research tasks into smaller, manageable units. This will allow you to allocate resources and estimate the duration of each task more accurately. Breaking down tasks also helps in identifying dependencies and potential bottlenecks.
Task dependencies are the relationships between different tasks in your research proposal. It is important to identify and define these dependencies in your Gantt chart. This will help you understand the sequence of tasks and ensure that they are scheduled in the correct order. For example, if Task B cannot start until Task A is completed, you need to represent this dependency in your Gantt chart.
Milestones are significant events or achievements in your research proposal. They serve as markers to track progress and provide a sense of accomplishment. Incorporating milestones in this chart will help you monitor the overall progress of your project and stay on track.
A Gantt chart is a dynamic tool that should be regularly updated and revised throughout the duration of your research proposal. As tasks are completed or delayed, it is important to reflect these changes in the chart. This will help you stay informed about the current status of your project and make necessary adjustments to meet your goals.
If you are working on a research proposal with a team, it is crucial to communicate and collaborate effectively. Share the Gantt chart with your team members and ensure that everyone understands their roles and responsibilities. Regularly discuss the progress and any changes in the chart to keep everyone informed and aligned.
One of the most common mistakes when using a Gantt chart is including too much information or too many details, which can make the chart cluttered and difficult to read. It is important to remember that the purpose of this chart is to provide a visual representation of the project timeline and key tasks, not to include every single task or subtask.
Another pitfall to avoid is using the Gantt chart as the initial project plan. While this chart can be a helpful tool for visualizing the project schedule, it should not be relied upon as the sole project planning tool. It is important to create a detailed project plan before creating this chart, which includes all the necessary tasks, dependencies, and resources.
Additionally, it is important to avoid manually creating the Gantt chart. Manually creating this chart can be time-consuming and prone to errors. Instead, it is recommended to use project management software or online tools that have built-in Gantt chart functionality. These tools allow for easier creation, editing, and updating of the Gantt chart.
Another common mistake is not considering the possibility of mistakes or delays in the project timeline. When creating a Gantt chart, it is important to leave room for error and account for potential delays in the schedule. This can help prevent unrealistic expectations and allow for adjustments as needed.
Lastly, it is important to avoid using the Gantt chart for resource management. While this chart can provide an overview of the project timeline, it is not designed to track resource allocation or availability. It is recommended to use separate resource management tools or spreadsheets to effectively manage and allocate resources for the project.
In conclusion, a well-designed Gantt chart can greatly enhance the planning and management of a research proposal. By effectively visualizing the project timeline and tasks, researchers can ensure that their proposal is feasible and achievable. With careful planning and regular updates, a Gantt chart can be a valuable tool for successful research proposal execution.